
Engage: The teacher will help students reflect on what they already know and identify any knowledge gaps. It is important to foster an interest in the upcoming concepts so students will be ready to learn. Teachers might task students with asking opening questions or writing down what they already know about the topic. This is also when the concept is introduced to students for the first time.
Materials: a map of your region’s air quality (you can find this on google)
Preparation: [15 ] Minutes
Facilitation of Learning Experience: [10 ] Minutes
Transition: [20 ] Minutes
Teacher will:
– Search a map of your region’s air quality (https://aqicn.org/map/europe/)
– Answer the questions for the map you found.
Students will:
take a look at the map and give a first idea. Let them think about what this map shows them.
Answer following questions:
– Can you see places where the air quality is better or worse? – At highways and industrial areas the air quality will be worse.
– Can you see a difference at different times of the day? During peak hours, air quality will be lower.
– How is the air quality in your area?
– How could you know the quality at your home? – by building your own sensor.
– What are the consequences of bad air quality? – the pollutants in the air increase the risk of cancer and cardiovascular disease.
Explore: During the exploration phase, students actively explore the new concept through concrete learning experiences. They might be asked to go through the scientific method and communicate with their peers to make observations. This phase allows students to learn in a hands-on way.
Materials: an example of the home made sensor
Preparation: [30 ] Minutes
Facilitation of Learning Experience: [10 ] Minutes
Transition: [ 10] Minutes
Teacher will:
– Create their own sensor, including the excel file.
– You can follow the step-by-step plan below
Students will:
– See the sensor for the first time
– Measure the air quality at school.
– What will we measure with this sensor? Dust in µg/m³
You can challenge the students before the project to get started with micro:bit already. For this you can use the following tool. For this tool you do not need micro:bit because you can simulate the basics on the PC.
https://makecode.microbit.org/
In this programming environment you can start your own project or you can select lessons. As a teacher you can choose whether you want the students to follow a lesson or to give them a low-threshold assignment (to make a countdown timer from 10 to 0).
Explain: This is a teacher-led phase that helps students synthesise new knowledge and ask questions if they need further clarification. For the Explain phase to be effective, teachers should ask students to share what they learned during the Explore phase before introducing technical information in a more direct manner, according to “The 5E Instructional Model: A Learning Cycle Approach for Inquiry-Based Science Teaching.” This is also when teachers utilise video, computer software, or other aides to boost understanding.
Materials:
– Micro:Bit
– Sensor:bit breakout board
Dust sensor for micro:bit: https://www.sossolutions.nl/elecfreaks-micro-bit-smart-science-iot-kit-exclusief-micro-bit
– pc or chromebook
Preparation: [15 ] Minutes
Facilitation of Learning Experience: [20 ] Minutes
Transition: [45 ] Minutes
Teacher will:
– guide the students through the steps
– make sure the necessary materials are present.
Students will:
Complete following steps:
– connect the dust sensor’s LED to the P1-port and connect the OUT-port to the P2-port. It should be like in the image.
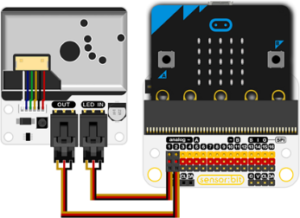
– Connect the micro:bit to the computer or chromebook.
– Go to https://makecode.microbit.org and make a new project.
– Choose: advanced extensions, find the iot (environment-and-science-iot) and download the blocks. And make the program.
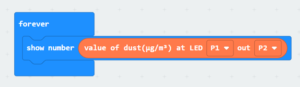
– students read the data from the micro:bit and record it in the excel file. They can design this file themselves or you can use the attached file. Preferably, choose to have the students design their own file.
– The attached file is one way to keep track of the data, but students may prefer a different format. This file was created for an assignment where students take turns taking the sensor home.
– Ensure that students collect sufficient results. This will ensure a more exact result. Have students take turns taking the sensor home and measuring the air quality at different times, measure the air quality at school during class, as a teacher take the sensor out for a change, …
You can use the excel file to record the data, but you can also go further into it. For example, you can:
– Pour the data into a graph to see what the air quality is at different times of the day.
– Using the data to create a map of the area in which the average air quality is made visible.
– Have students think about other ways to display the data clearly.
location of measurement: school
| date | time of day | dust value (in µg/m³) |
| 25/08/2021 | 16:00 | …… |
Elaborate: The elaboration phase of the 5E Model focuses on giving students space to apply what they’ve learned. This helps them to develop a deeper understanding. Teachers may ask students to create presentations or conduct additional investigations to reinforce new skills. This phase allows students to cement their knowledge before evaluation.
Materials: buzzer, the sensor
Preparation: [20 ] Minutes
Facilitation of Learning Experience: [30 ] Minutes
Transition: [ 50] Minutes
Teacher will:
– Use the steps below to make an example.
– Show the example to the students
Students will:
A micro:bit normally has a built-in buzzer. If this buzzer is not there or if it is not sufficient, you can always add a buzzer.
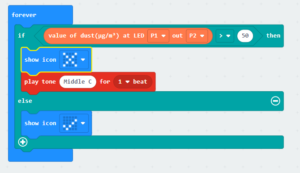
Our sensor measures the dust in the air. Because this measures all the dust, this is the PM10 value. Look up the limit value for your region. If this value is exceeded, an alarm should be heard. In this example the limit value is 50µg/m³.
Have students research on their own how to create this program. If they can’t, you can help them get started step by step. As much as possible, try to let them come up with their own solution rather than giving them the solution.
With the program below, you can trigger the alarm when the value gets too high. In this example, the lights are also programmed to indicate whether the value is okay or too high.
Evaluate: The 5E Model allows for both formal and informal assessment. During this phase, teachers can observe their students and see whether they have a complete grasp of the core concepts. It is also helpful to note whether students approach problems in a different way based on what they learned. Other helpful elements of the Evaluate phase include self-assessment, peer-assessment, writing assignments, and exams.
Materials: the student’s sensors
Preparation: [10] Minutes
Facilitation of Learning Experience: [10] Minutes
Transition: [15] Minutes
Teacher will:
– Observe the students in the entire process and during the final evaluation.
Students will:
– The students will exchange their results. If there are any remarkable results, the students can start a discussion.
– All results can be put together to make one conclusion. This will be the conclusion of this experiment.
Independent learning tasks (ILT): Provide two-three challenges to students to complete before the next lesson.
The micro:bit has a lot more sensors to offer. You can buy them by looking at the micro:bit site to find the local vending points. By using similar programming blocks, the student can build different sensors.
students can add a buzzer to sound an alarm if the air quality is too low. They can then use this to know when to ventilate a room, for example. They can include this buzzer in their design.
Annex. I.
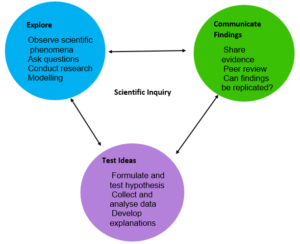
Scientific Inquiry
Annex II.
Test Your Idea Template
| Testing Your Idea Organizer | |
| 1. Investigative Question
Your question should relate the manipulated variable to the responding variable. |
Investigative Question: What influence does the time of day have on the measured value? How can you explain this? |
| 2. Hypothesis
Your hypothesis should be written as an “IF, THEN, BECAUSE” statement. |
|
| 3. Variables
● Manipulated Variable (What you will change) ● Responding Variable (What you will measure) ● Controlled Variables (What will remain constant throughout the test) |
|
| 4. Materials
Create a list of all materials you need.
|
|
| 5. Procedure
Should include… ● Manipulated Variable ● Responding Variable ● Controlled Variables ● Logical, Repeatable Steps ● Recording of Specific Data ● Repeated Trials |
|
| 6. Data
● Design a table for organising data you will be collecting during your test. ● Use your procedure to collect and record data. ● Display your data using appropriate graphs and/or charts.
|
|
| 7. Conclusion
● State your conclusion relating the manipulated variable to the responding variable. ● Use data to justify your conclusion. ● State whether your hypothesis can be accepted or rejected based on observed data.
|
|
| 8. Analysis
● Discuss potential sources of error and the potential influence on your results.
● Provide ideas on how and why the experimental design might be improved.
● Describe surprising data.
● List ideas for revising your test idea or new related ideas to test.
|
|
| 9. Present your findings to your class. |
|
